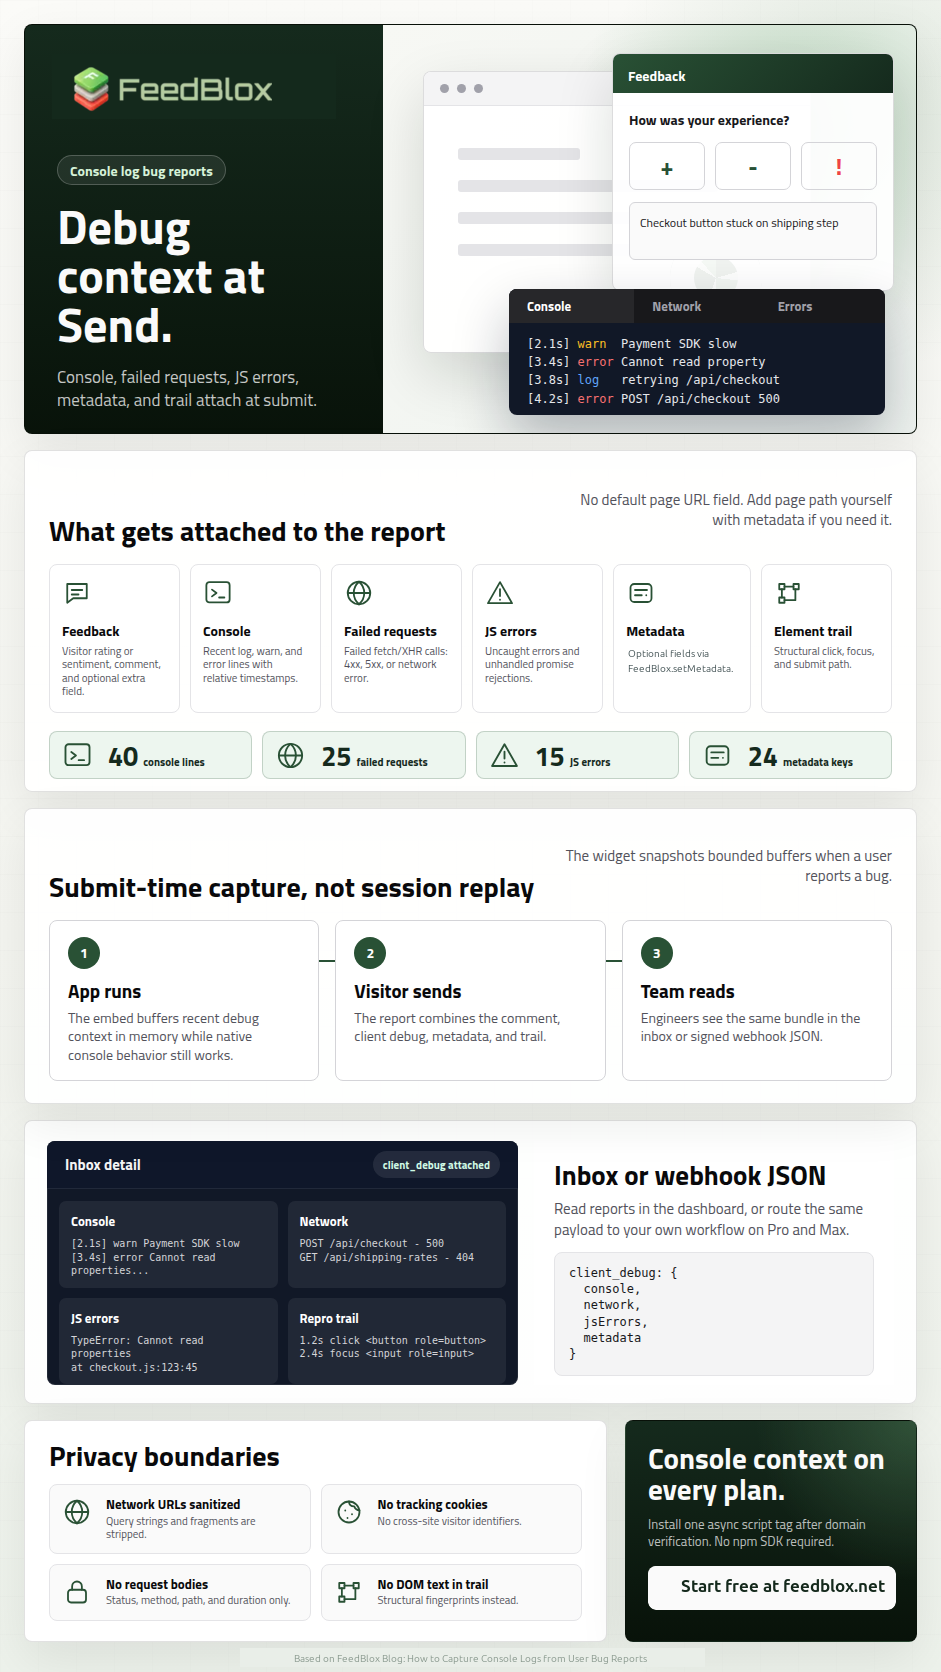
When a user says "the checkout button does not work," the useful answer is rarely the comment alone. Engineers need a console log bug report: recent console.log, console.warn, and console.error lines, failed network calls, and uncaught JavaScript errors from the session where the bug happened.
Most teams still ask visitors to open DevTools, copy a stack trace, or email a screenshot. That workflow fails in production. This guide explains what to capture, when to capture it, and how to ship console context with every report without burdening users.
Why "Open DevTools and Send a Screenshot" Fails
Non-technical visitors will not open the browser console. Even technical users often clear the tab, navigate away, or refresh before support asks for logs. Screenshots of the console are blurry, truncated, and missing network timing.
A good console log bug report should attach context automatically when the visitor clicks submit - not minutes later in a follow-up email.
- Users do not know how to open DevTools on mobile Safari or embedded WebViews
- Console output scrolls away after navigation or a full page reload
- Screenshots miss failed fetch URLs, status codes, and timing
- Support tickets lose JS error stack hints when pasted into chat tools
What to Include in a Console Log Bug Report
Console lines alone are not enough for a complete picture, but they are the foundation. Pair them with failed network activity and uncaught errors so engineering can distinguish a UI bug from a broken API call.
- Console logs - recent log, warn, and error lines with relative timestamps
- Failed network requests - fetch and XHR calls that returned 4xx, 5xx, or network errors (method, URL path, status)
- Uncaught JS errors - message and source hints from
window.onerrorand unhandled promise rejections - Page URL - the route where the visitor submitted feedback
- Optional app metadata - user ID, plan tier, app version, or workspace ID you attach from your own code
- Repro summary - a short click-and-focus trail so you know what they interacted with before sending
Capture at Submit Time, Not Continuous Streaming
Session replay tools stream the entire visit to a third party. That is powerful for UX research but heavy for bug capture: large payloads, privacy review, and ongoing cost.
A lighter pattern is a bounded ring buffer in the browser. While your app runs, the embed keeps the last N console lines and failed requests in memory. Nothing leaves the visitor's device until they submit a bug report. At submit time, the widget snapshots the buffer and sends it with the comment.
FeedBlox uses this model: up to 40 console lines, 25 failed network entries, and 15 JS error events per report, with message and URL fields truncated to keep payloads readable in an inbox.
DIY: Wrapping Console Methods Yourself
You can prototype console capture before adopting a widget. The idea is to preserve the original console.log (and warn/error) functions, push structured entries into an array, and still call the native methods so DevTools behavior stays intact.
Minimal console ring buffer (illustrative)
const consoleBuf = [];
const MAX = 40;

function push(level, args) {
  consoleBuf.push({
    t: Date.now(),
    level,
    message: args.map(String).join(' ')
  });
  if (consoleBuf.length > MAX) consoleBuf.shift();
}

(['log', 'warn', 'error']).forEach((level) => {
  const orig = console[level].bind(console);
  console[level] = (...args) => {
    push(level, args);
    orig(...args);
  };
});

// On bug-report submit:
const payload = { console: consoleBuf.slice() };
You will also need fetch/XHR interception, error listeners, a submit endpoint, storage, and an inbox UI. That is why teams adopt a javascript bug report tool once the prototype proves the workflow.
Using a Bug Report Widget With Built-In Capture
FeedBlox ships client debug on Free, Pro, and Max: console output, failed network calls, JS errors, optional metadata via FeedBlox.setMetadata, and an element-trail repro summary on every submission. Visitors rate or comment in a small panel; engineers read the same bundle in the inbox or webhook JSON.
Install is one async script tag after domain verification - no npm SDK required to start.
FeedBlox embed snippet
<script
  src="https://feedblox.net/widget.js"
  data-site-id="YOUR_SITE_ID"
  data-token="YOUR_EMBED_TOKEN"
  data-position="bottom-right"
  async
></script>
Optional metadata for SaaS apps:
FeedBlox.setMetadata({
  userId: 'user_123',
  plan: 'pro',
  version: '2.4.1'
});
FeedBlox Console Log Capture on Every Plan
FeedBlox bundles console, network, and JS error capture on Free, Pro, and Max - not as a paid add-on. Each report includes a bounded ring buffer (40 console lines, 25 failed network entries, 15 JS errors) plus an element-trail repro summary.
Read the dedicated console log bug reports overview for limits, privacy, and inbox examples. Compare with session replay in our FeedBlox vs LogRocket guide if you are deciding how much capture you need.
Pair Console Logs With Visitor Bug Reports
Console output alone does not replace a clear user description. The best workflow combines a short visitor comment ("checkout button stuck") with automatic debug context. See how to collect bug reports from website visitors for launcher placement and triage.
SaaS teams often attach metadata (plan, userId, version) so engineers filter reports without reading every line of console noise.
Privacy and Disclosure
Console lines can contain PII if your app logs emails, tokens, or account IDs. Sanitize logging in production, avoid logging secrets, and disclose in your privacy policy that feedback submissions may include technical debug data.
FeedBlox does not set tracking cookies on visitors for this capture. URLs in network entries are path-only (query strings stripped) to reduce accidental leakage. See our Widget Data and GDPR guide for the full field list site owners should disclose.
Next Steps
If you are evaluating capture for a live product, start with one staging site, submit a test report from a page that throws a controlled error, and confirm the inbox shows console and network context you can act on.
Read the bug reporting use case, follow the install guide, or create a free account to run the widget on your own app.
More in this series: best free feedback widgets, Next.js install, and SaaS bug report template.